5 Export
After a deployment, the data will need to be downloaded from the logger. The following section describes how to export the data into a format that can be recognised by the Mini Buoy App. Select the correct software tab according to the logger type being configured:
To export data from the MSR145W B4:
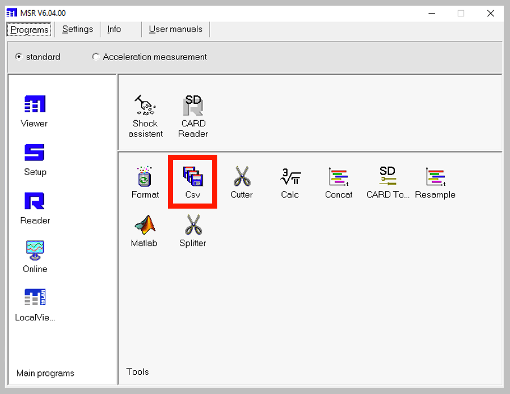
- Open the MSR software
- Double-click
Csv
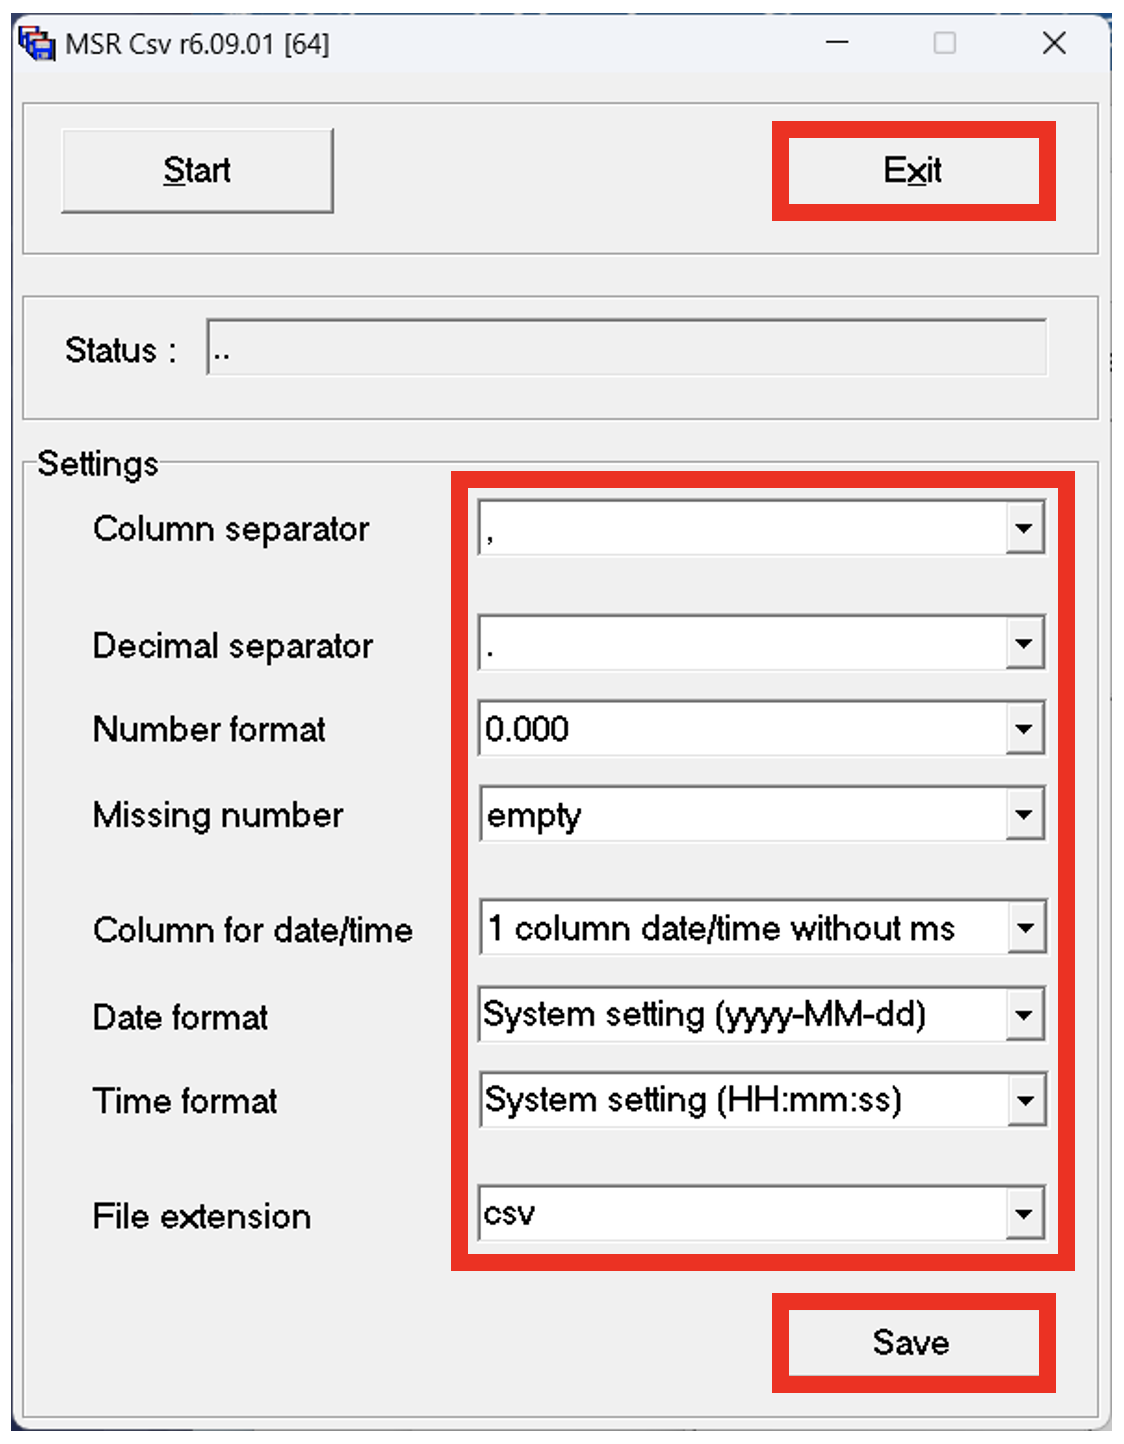
- Set
Column separatorto, - Set
Decimal separatorto. - Set
Number formatto0.000 - Set
Missing numbertoempty - Set
Column for date/timeto1 column date/time without ms - Set
Date formattoSystem setting (yyyy-MM-dd) - Set
Time formattoSystem setting (HH:mm:ss) - Set
File extensiontocsv - Click
Save - Click
Exit
Configuring the Csv settings only needs to be done once.
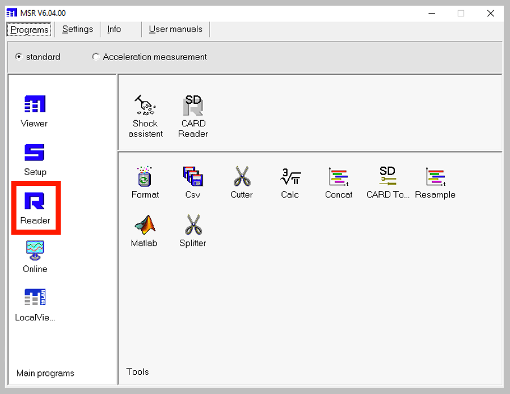
- Connect your data logger with the USB cable
- Double-click
Reader
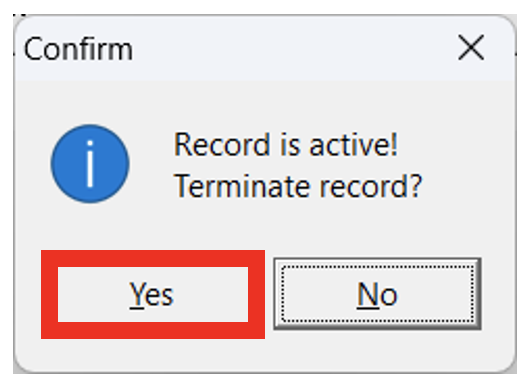
If the logger is still gathering data, a Record is active! window will appear. The logger needs to stop logging before data can be retrieved. To terminate the record, click Yes.
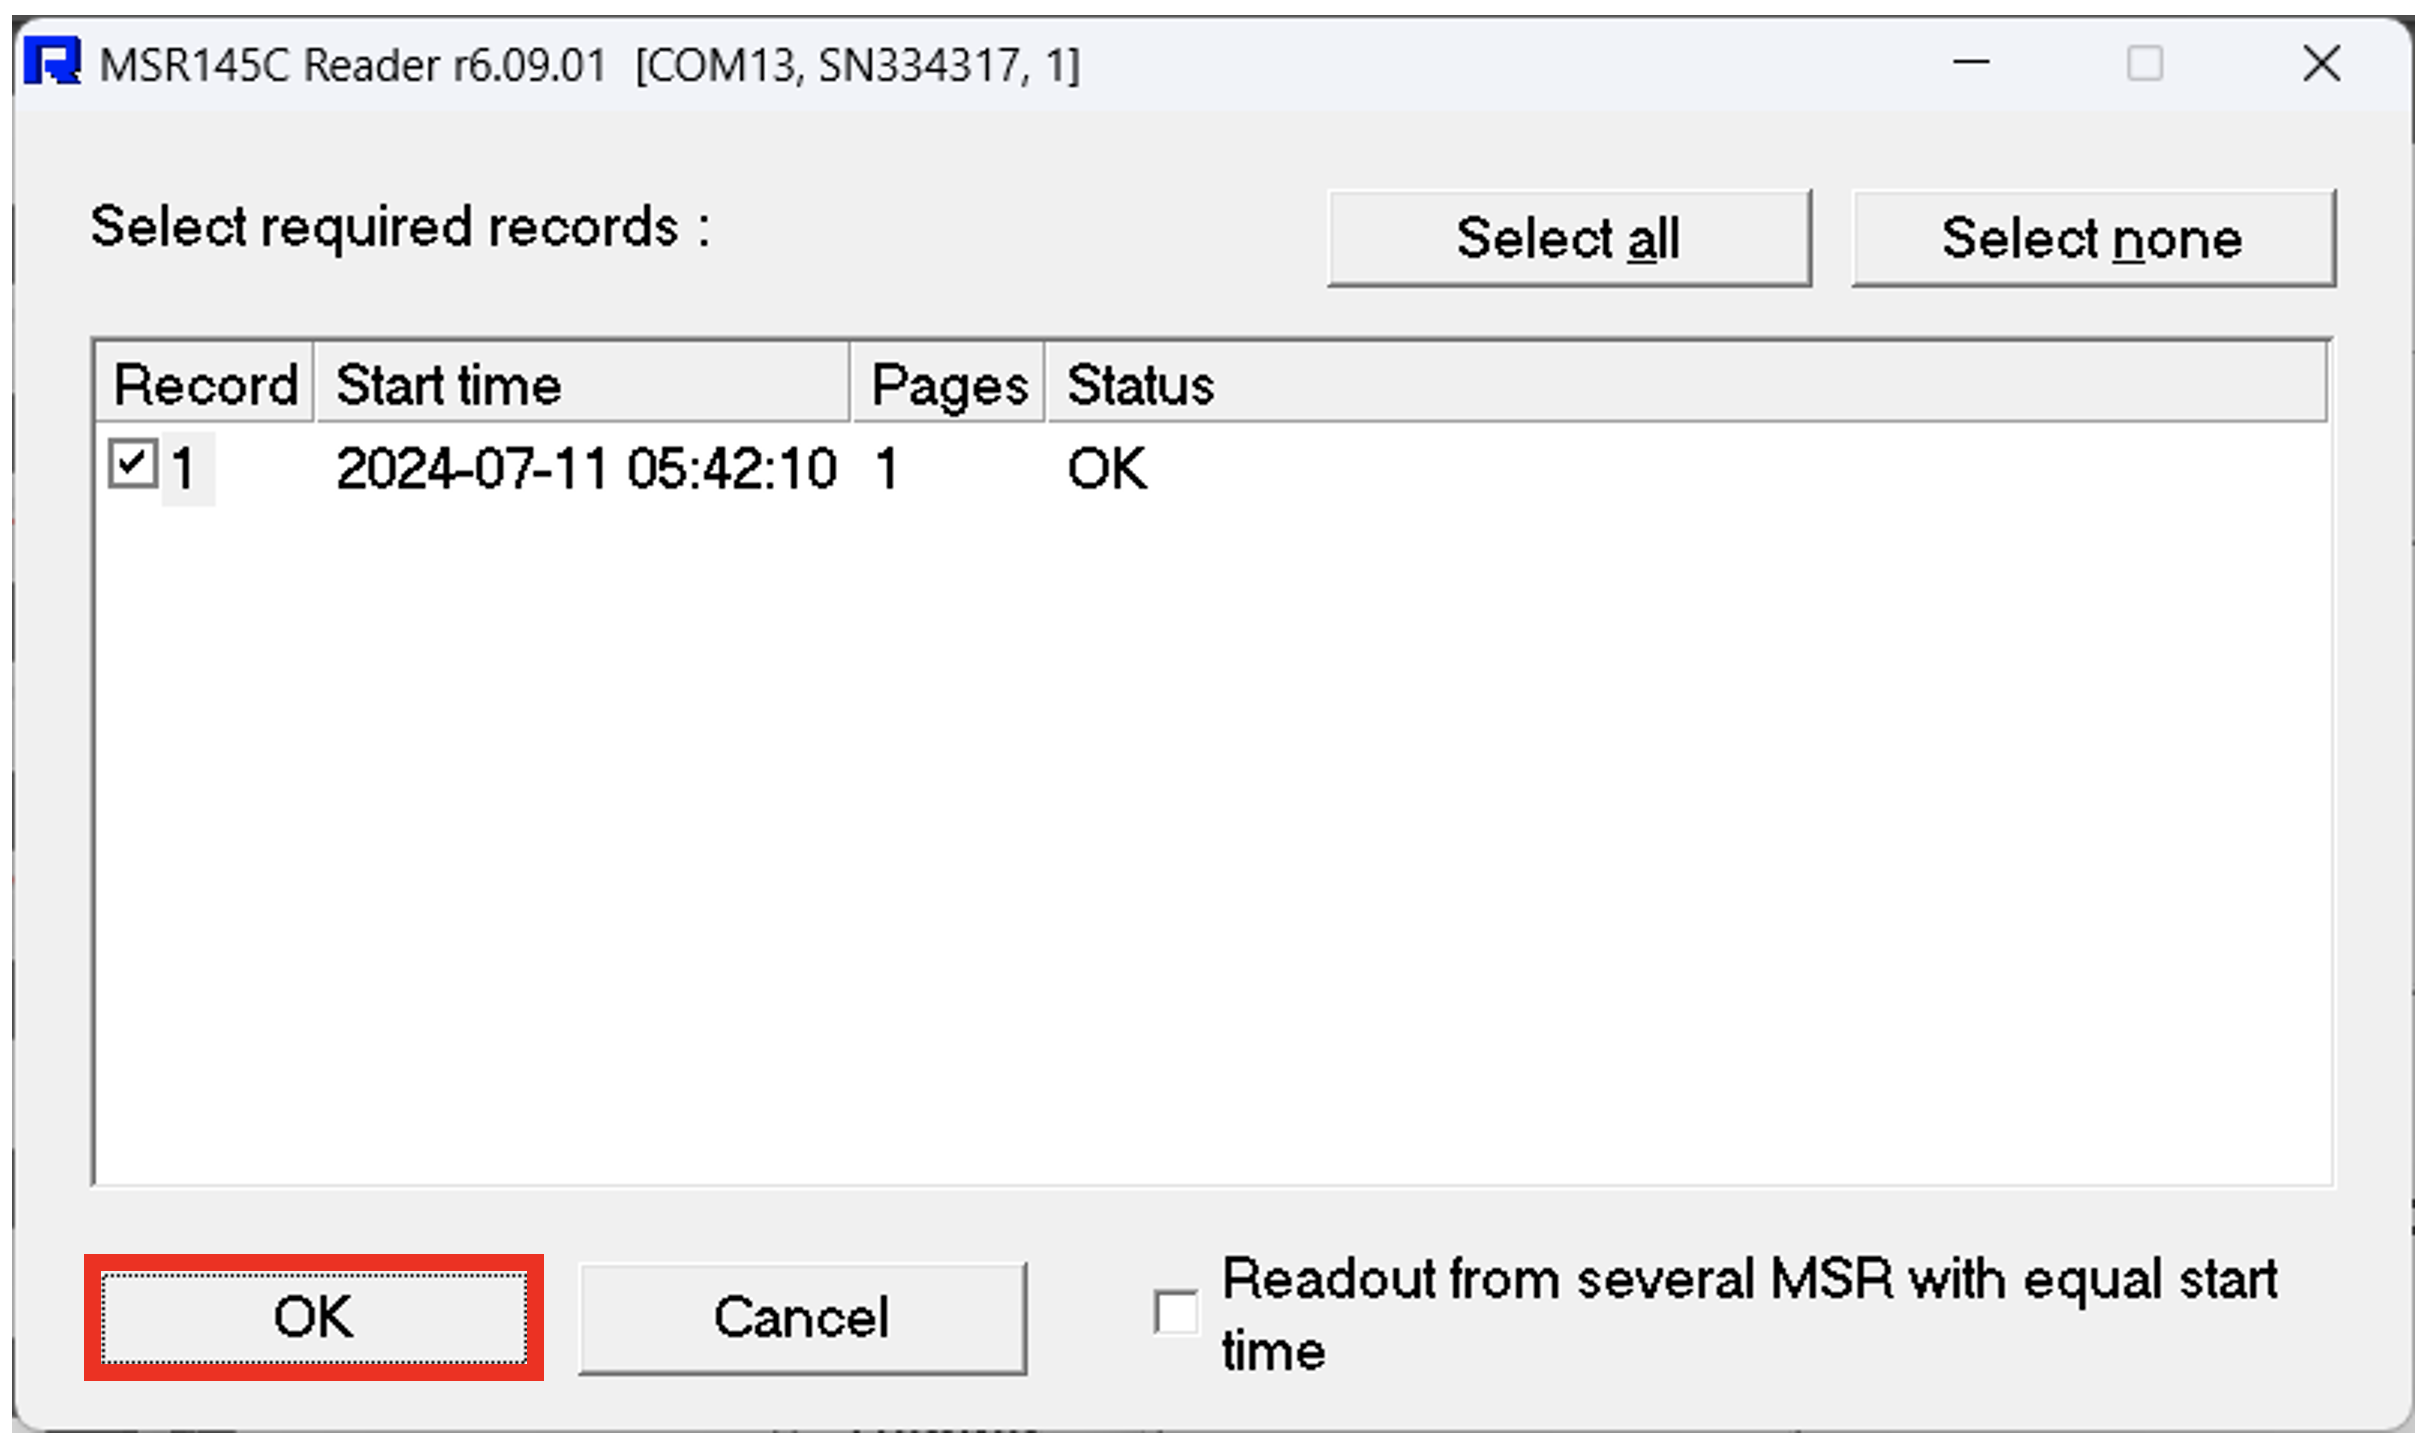
- Click
OKto select the data record
The MSR software will first create an .msr file in which the data is stored, then automatically load the data in the Viewer window. The data should look similar to the graph below, with low tide recorded as 0 and high tide recorded around -1.
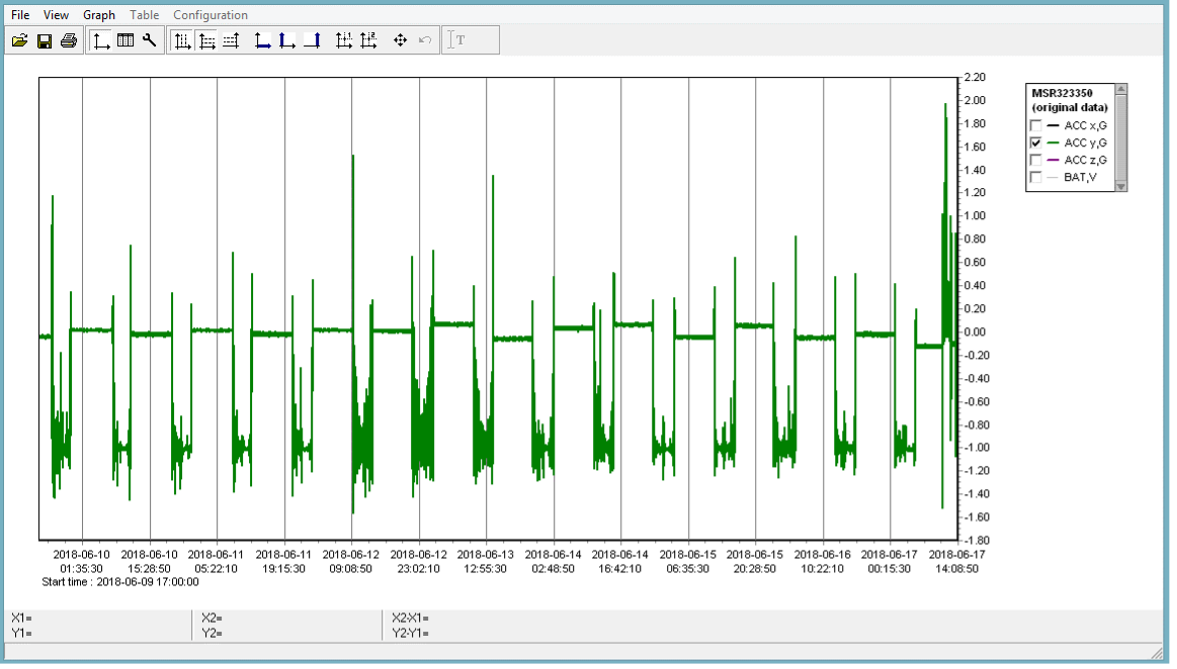
There may be spurious data at the start and end of a survey (e.g. when the Mini Buoy was logging whilst in transit). To remove this, use left click to drag a box over the usable data. To reset the window, click the Auto scale icon  .
.
- Select
File>Export time window as text… - Select an appropriate folder to save the data as a .csv file

The data has now been exported. Quit MSR and disconnect the logger.
To export data from the Pendant G Data Logger:
- Open the HOBOware software
- For Mac OS, Open the preferences window by selecting
HOBOwareand thenSettings.... On Windows, after opening the Hobo software, selectFileand thenPreferences....

- Select
General,Export Settings, and ensure thatSeparate date and time into two columnsis unchecked and setTime formatto24-Hour. - Press
OK.

Connect your Pendant sensor to it’s base station and click on the “Readout device” icon

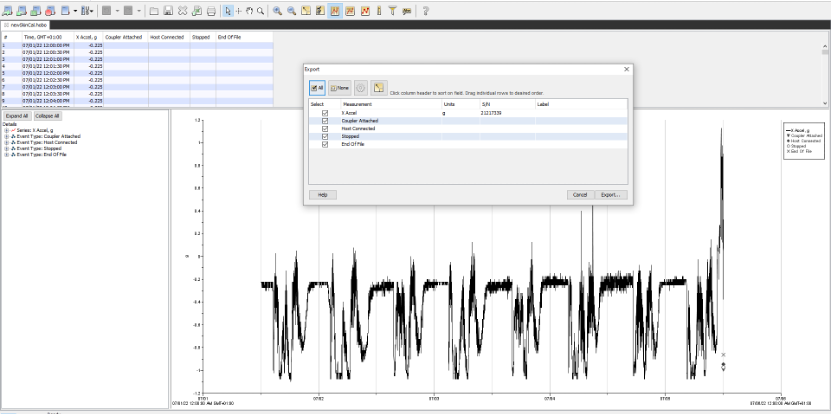
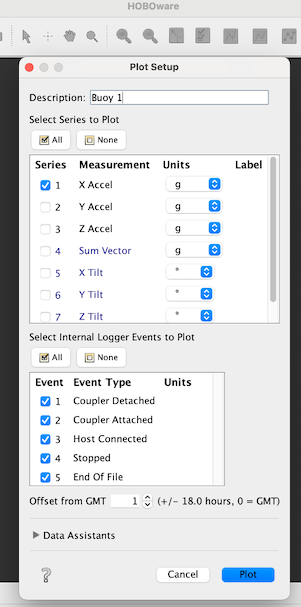
Once the data has downloaded, a
Plot Setupwindow will pop up, withinSelect series to plotensureX Accelbox is checked and all other boxes are unchecked.
- Select
Plot - Select
Export
- Save the file as
.csv