3 Configuration
Prior to each deployment of the Mini Buoy, the data logger will need to be fully charged, have a full memory, and be correctly configured according to the user’s requirements. The following section describes how to configure the MSR145W B4 (used in both the B4 and B4+ Mini Buoy designs) and HOBO Pendant G acceleration data loggers. Select the correct software tab according to the logger type being configured:
The free ‘MSR’ software to configure the MSR145W B4 logger can be downloaded here. The software is only compatible with a Windows PC. The cable, provided with the logger, is used to both configure and charge the logger.
To configure the MSR145W B4:
- Download and install the MSR software onto a Windows PC
- Connect a logger to the PC via the cable provided. A yellow LED will light up on the logger, indicating the internal battery is being charged. The light will extinguish once the battery is fully charged
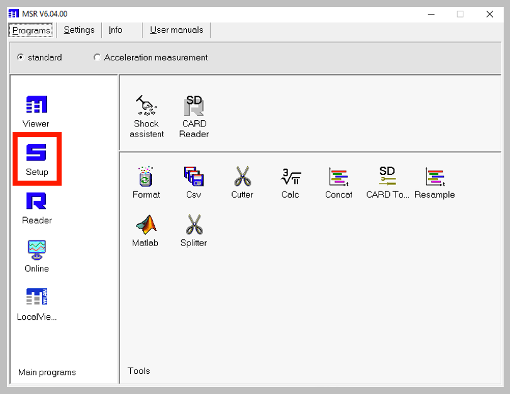
- Open the MSR software
The MSR software appearance differs depending on which model of MSR145W B4 was purchased. Whilst using different models does not affect the performance of a Mini Buoy, the setup procedure differs.
To confirm the model of the logger:
- Double-click
Setup
- Under
General, confirm whetherMSR typeisMSR145CorMSR145B
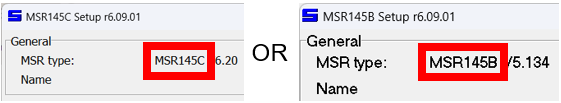
Select the correct tab to continue with the setup:
- Select the
Format memorytab - Click
Format>Yes. This will delete any data stored on the logger
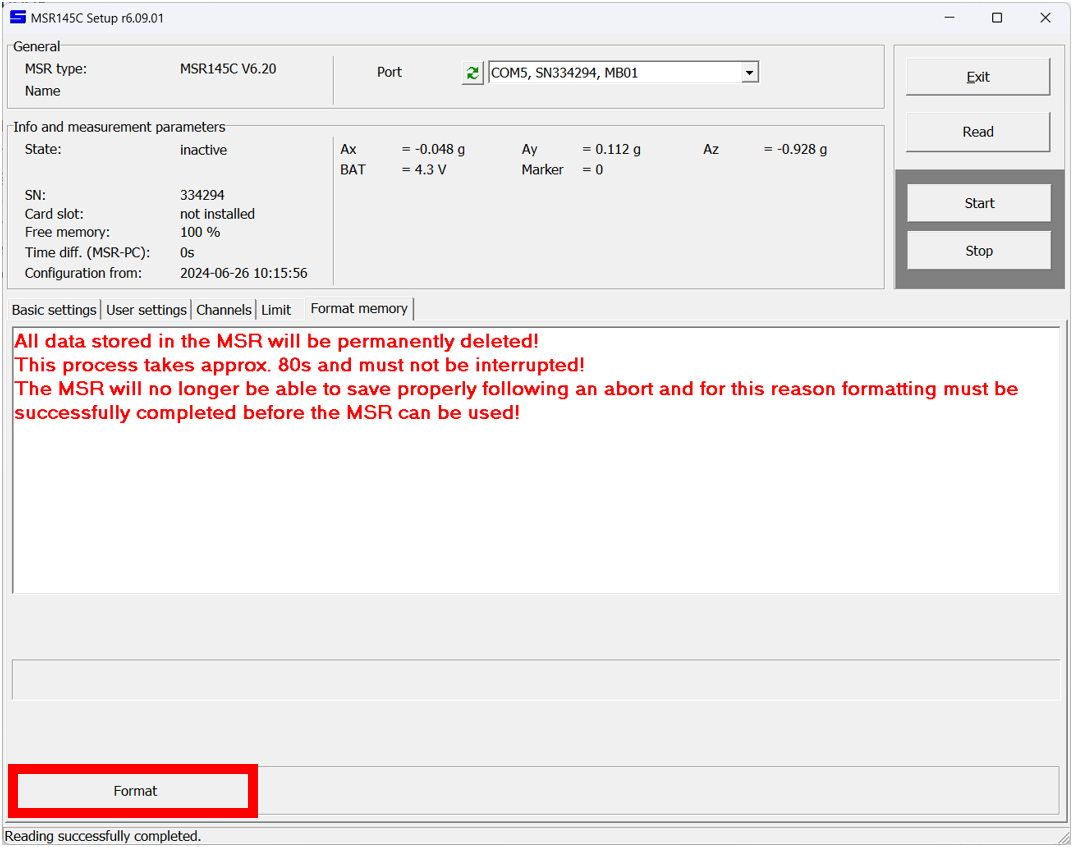
- Once formatting is complete, click
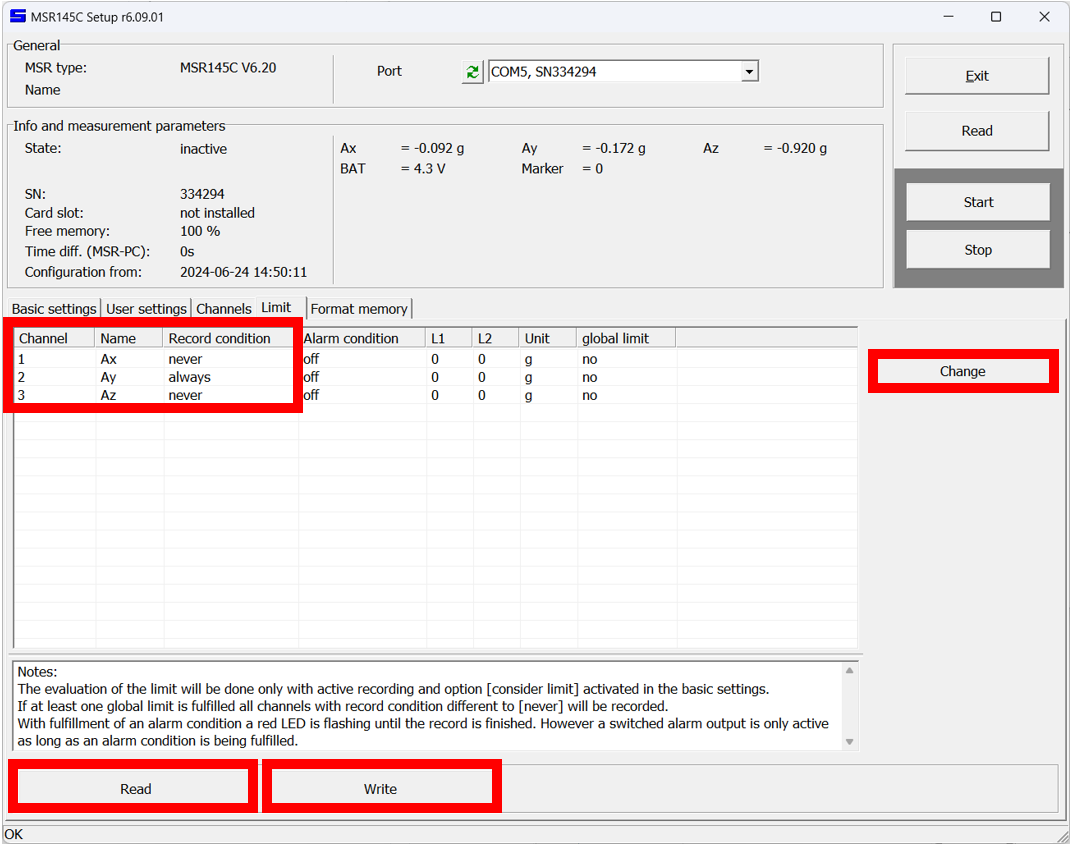
OK - Select the
Limittab - Click
Read - Select
Channel 1 | Axand clickChange - Under the
Record conditiondrop-down menu, selectnever - Click
OK - Select
Channel 3 | Azand clickChange - Under the
Record conditiondrop-down menu, selectnever - Click
OK - Click
Write
Only Channel 2 | Ay should now display always. This means only acceleration data along the y-axis will be gathered. Only y-axis acceleration data is used to measure hydrodynamics.
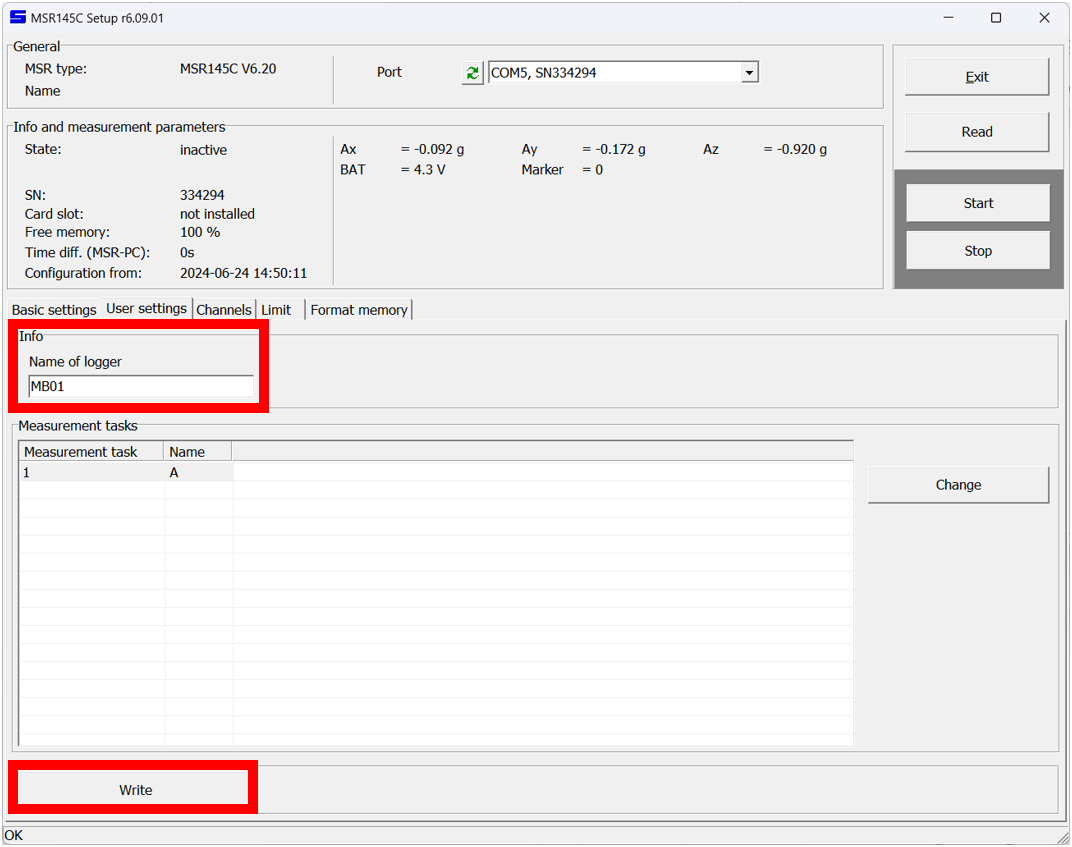
- Select the
User settingstab - Under
Info, enter a suitableName of logger - Click
Write
It is good practice to keep a record of the logger name and serial number for data analysis.
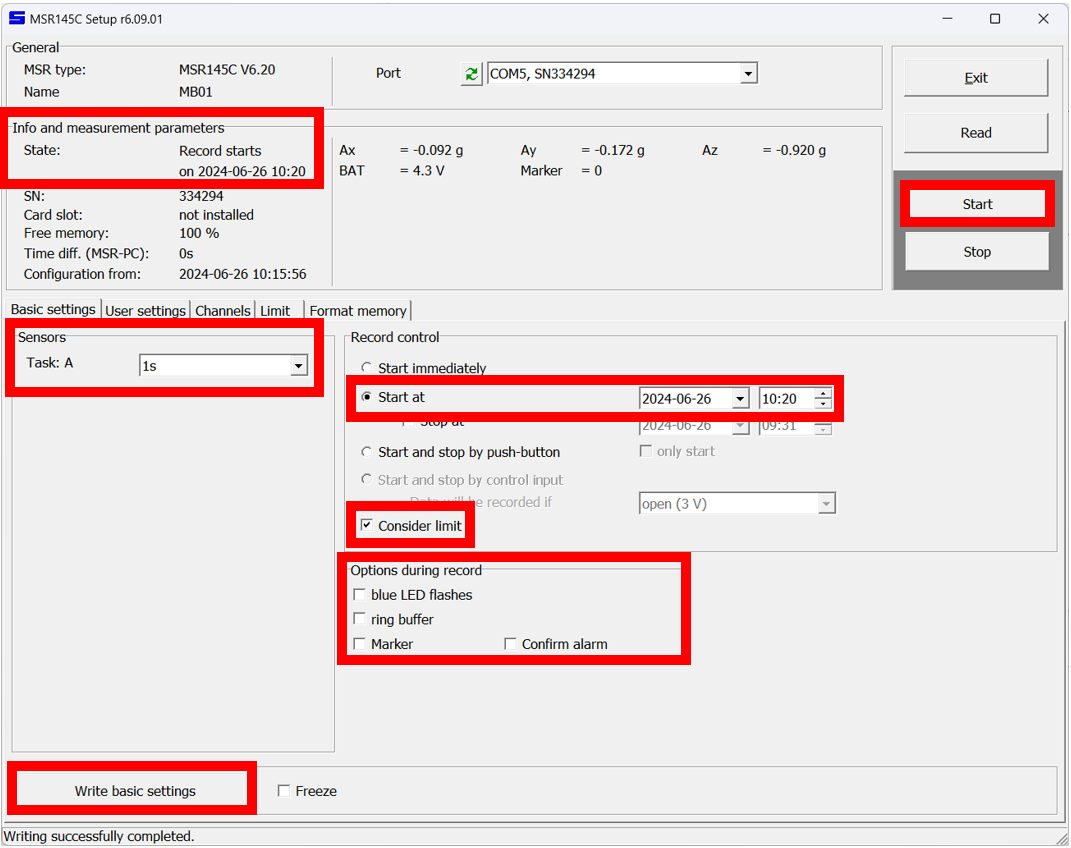
- Select the
Basic settingstab - Under
Sensors, use the drop-down menu to select a sampling rate between1sand10s
Sampling rate determines the precision of the data and the duration of a survey. A higher sampling rate improves precision but lowers survey duration. Use the table below to select an optimum balance between sampling rate and survey duration.
| Sampling rate | Survey duration |
|---|---|
| 1s | 24 days |
| 2s | 48 days |
| 5s | 120 days |
| 10s | 240 days |
- Under
Record control, checkStart at - Set the logger to
Start ata specific date and time
It is good practice to set the start time as two hours before the Mini Buoy is expected to be inundated.
- Check
Consider limit - Under
Options during record, uncheck all options - Click
Write basic settings - Click
Start - Under
Info and measurement parameters, confirm thatStatereadsRecord starts on yyyy-mm-dd hh:mm
- Click
Exit - Disconnect the MSR145W B4 logger from the computer
The logger is now primed for data collection.
- Select the
Format memorytab - Click
Format>Yes. This will delete any data stored on the logger
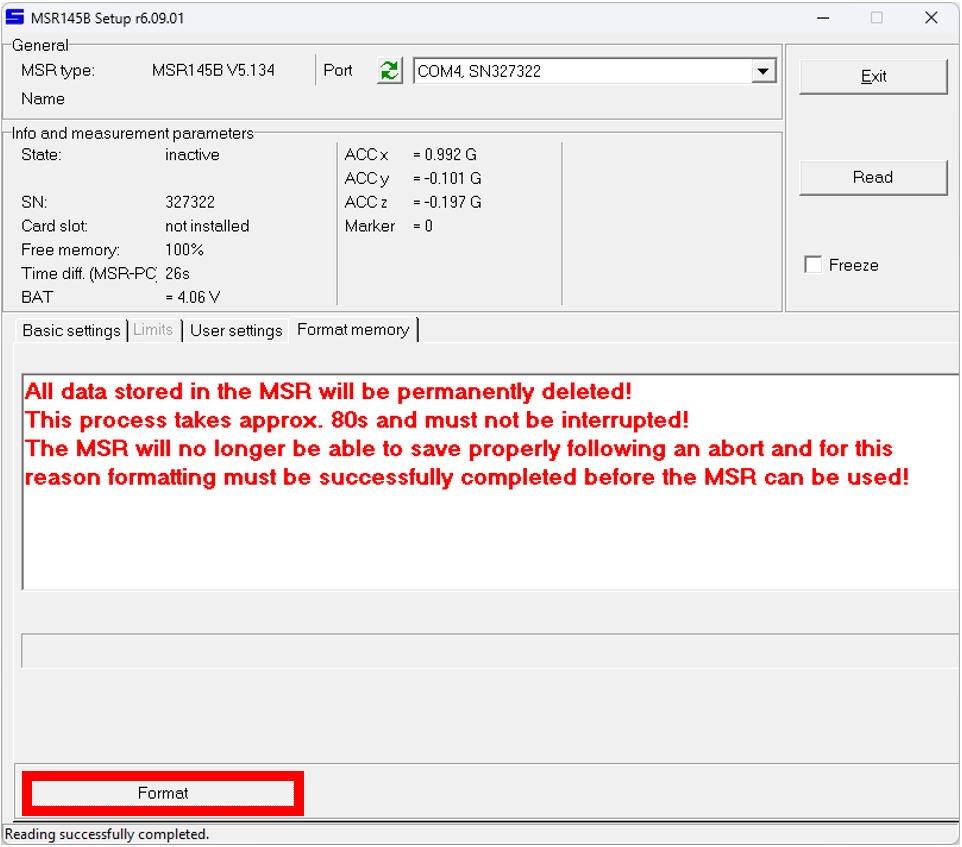
- Once formatting is complete, click
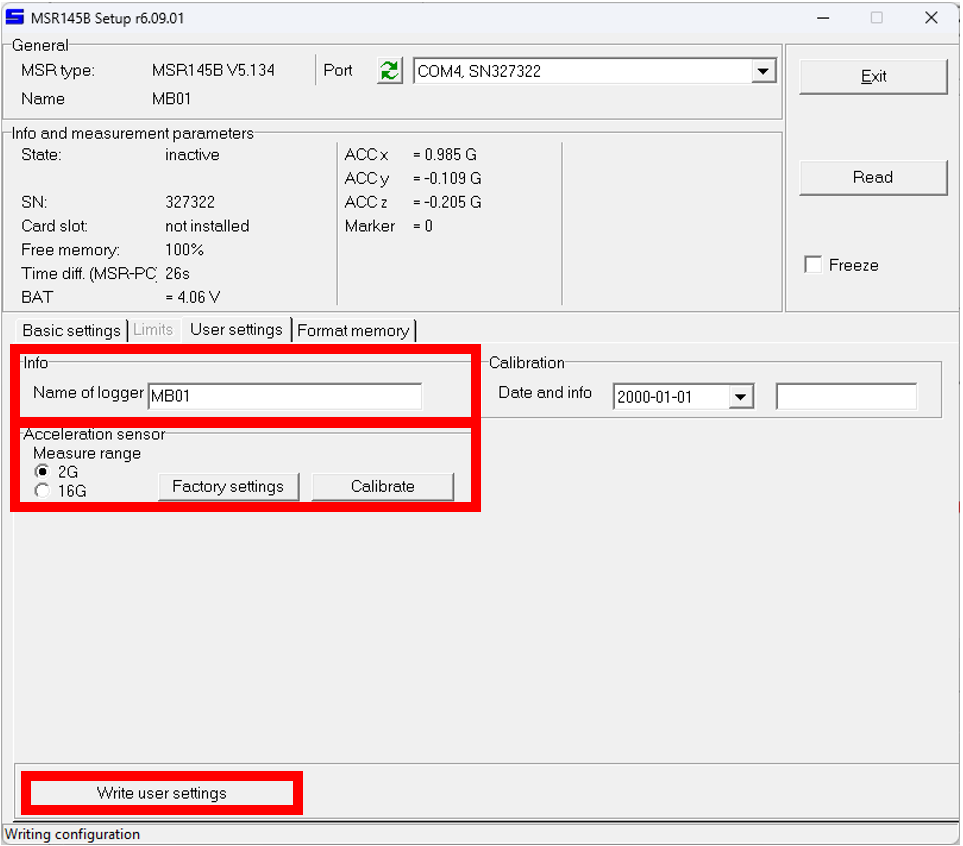
OK - Select the
User settingstab - Under
Acceleration sensor, set theMeasure rangeto2G - Under
Info, enter a suitableName of logger
It is good practice to keep a record of the logger name and serial number for data analysis.
- Click
Write user settings
- Select the
Basic settingstab - Under
Record control, check theLimits activebox - Select the
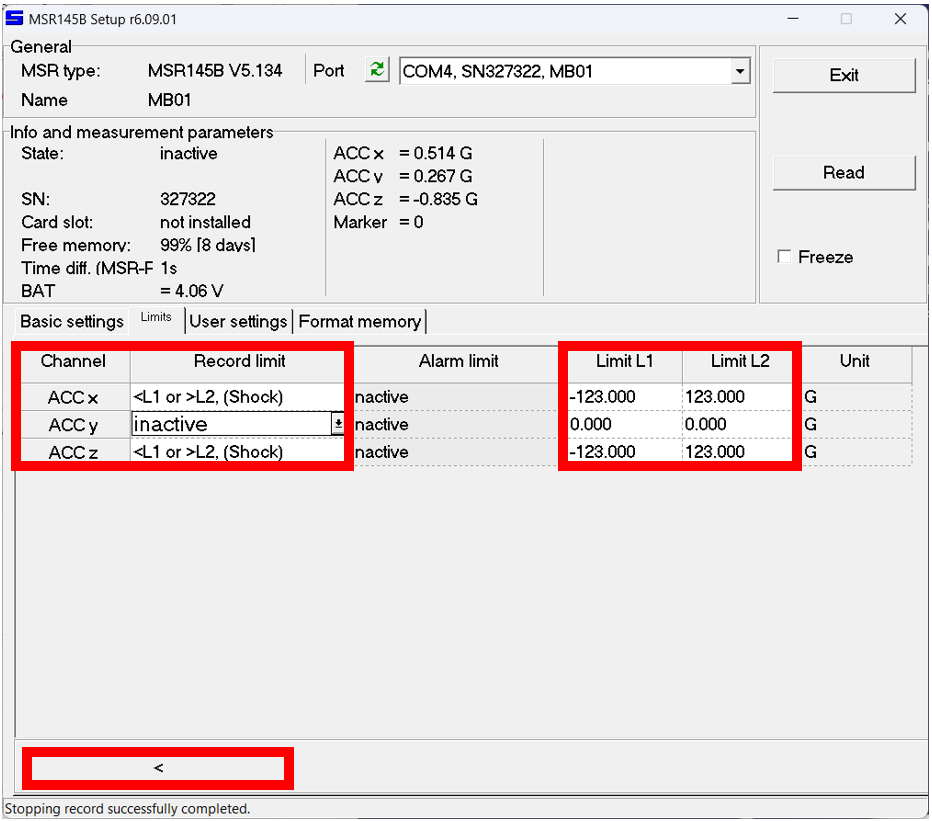
Limitstab - Under
Record limit, use the drop-down menu forACC xto select<L1 or >L2, (Shock) - Under
Limit L1, set the value forACC xto-123(i.e. negative) - Under
Limit L1, set the value forACC xto123(i.e. positive) - Under
Record limit, use the drop-down menu forACC zto select<L1 or >L2, (Shock) - Under
Limit L1, set the value forACC zto-123(i.e. negative) - Under
Limit L1, set the value forACC zto123(i.e. positive)
Only ACC y should now display inactive. This means limits on the y-axis logger are inactive, so measurements will always be taken. For the other axes, data is only recorded if extremely high (and unrealistic) acceleration values are detected - effectively disabling them. Only y-axis acceleration data is used to measure hydrodynamics.
- Click
<
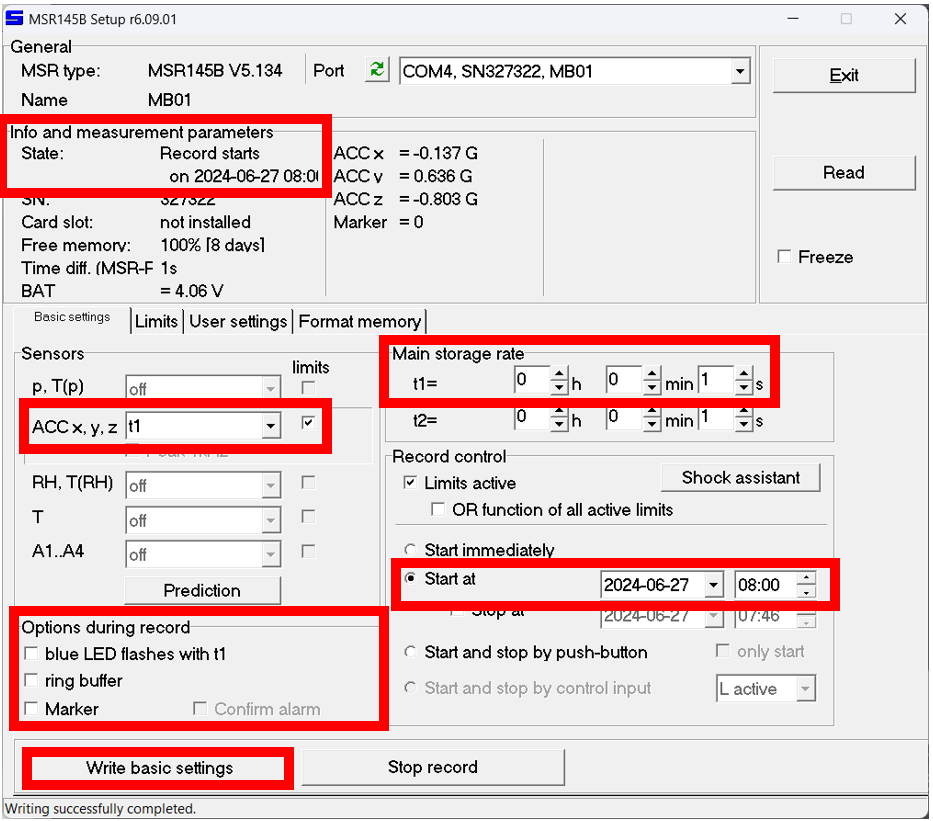
Basic settingsshould now be displayed. If not, select the tab- Under
Sensors, selectt1from theACC x, y, zdrop-down menu - Under
Main storage rate, sett1=to a sampling rate between 1 and 10 seconds
Sampling rate determines the precision of the data and the duration of a survey. A higher sampling rate improves precision but lowers survey duration. Use the table below to select an optimum balance between sampling rate and survey duration.
| Sampling rate | Survey duration |
|---|---|
| 1 s | 24 days |
| 2 s | 48 days |
| 3 s | 72 days |
| 4 s | 96 days |
| 5 s | 120 days |
| 6 s | 144 days |
| 7 s | 168 days |
| 8 s | 192 days |
| 9 s | 216 days |
| 10 s | 240 days |
- Under
Record control, checkStart at - Set the logger to
Start ata specific date and time
It is good practice to set the start time as two hours before the Mini Buoy is expected to be inundated.
- Under
Options during record, uncheck all options - Click
Write basic settings - Under
Info and measurement parameters, confirm thatStatereadsRecord starts on yyyy-mm-dd hh:mm
- Click
Exit - Disconnect the MSR145W B4 logger from the computer
The logger is now primed for data collection. A blue light will flash until the start date and time is reached.
The free ‘HOBOware’ software to configure the Pendant G Data Logger can be downloaded here. The software is compatible with both Windows and macOS. A HOBO Optic USB Base Station (sold separately) is required to configure and charge the logger.
To configure the HOBO Pendant:
- Download and install the HOBOware software
- Connect a logger to the PC via the HOBO Optic USB Base Station
- Open the HOBOware software
- Click the
Select Devicedrop-down menu
- Tick the USB or serial port tabs according to how the data logger was connected to the computer
- Select the
Launchicon
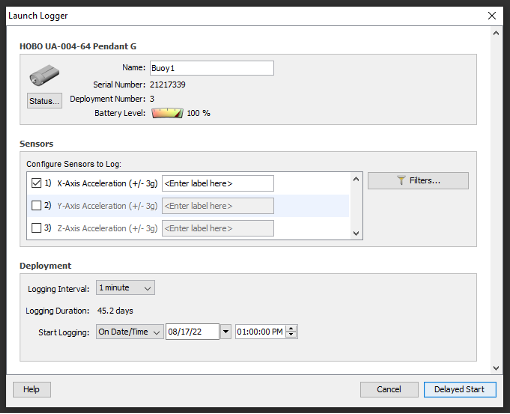
- Set a name for the logger under the
Namefield - Select the
Sensorstab - Check
X-Axis Acceleration (+/- 3g) - Under
Configure Sensors to Log, checkX-Axis Acceleration (+/- 3g) - Select the
Deploymentstab - Use the drop-down menu to set
Logging Intervalto the desired sampling rate
Sampling rate determines the precision of the data and the duration of a survey. A higher sampling rate improves precision but lowers survey duration. Use the table below to select an optimum balance between sampling rate and survey duration.
| Sampling rate | Survey duration |
|---|---|
| 20 s | 15 days |
| 1 min | 45 days |
| 2 min | 90 days |
| 10 min | 1.2 years |
- Select the
Deploymentstab - Set the
Start Loggingdate and time
It is good practice to set the start time as two hours before the Mini Buoy is expected to be inundated.
- Click
Delayed Start - Disconnect the Pendant logger from the computer
The logger is now primed for data collection.